Data Supplement: A Review of Competency Restoration Services for Inmates in County Jails
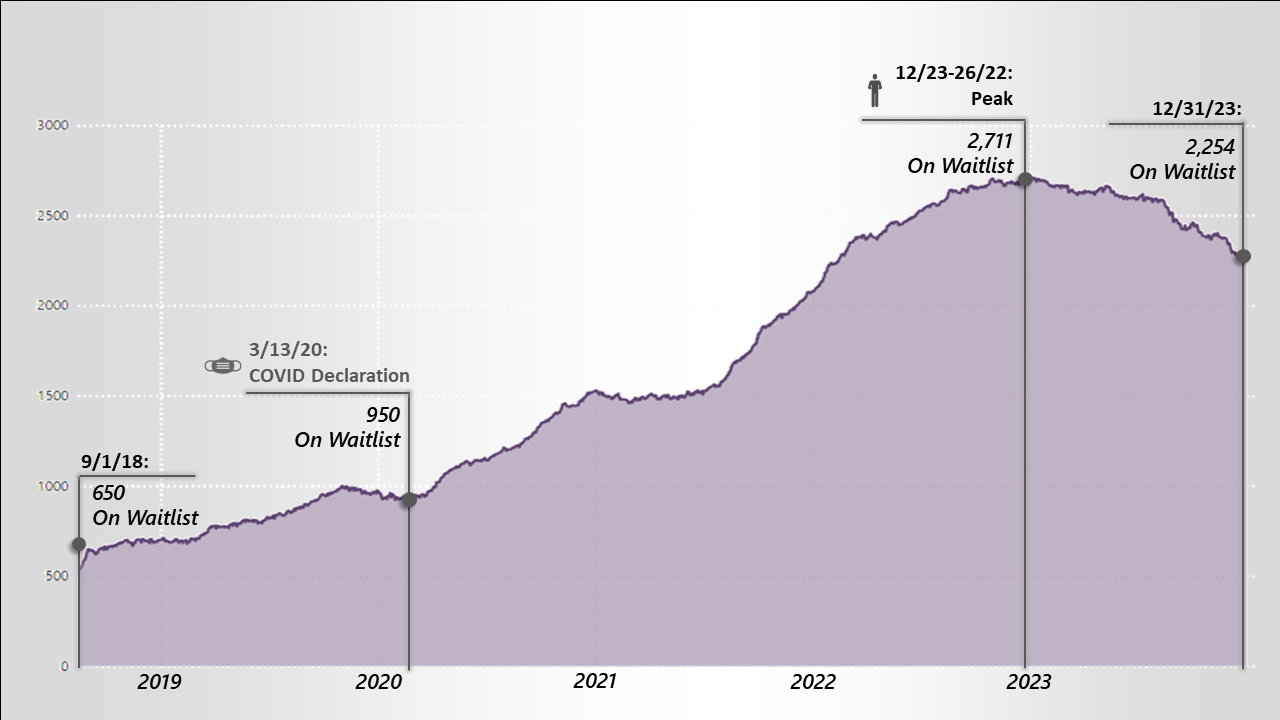
This data supplement contains interactive visualizations of data reported on in the State Auditor’s Office’s A Review of Competency Restoration Services for Inmates in County Jails. The following sections present information collected during this project in interactive formats. The visualization below shows the counts of state hospital staffing, census, and the waitlist for competency restoration from September 1, 2018, through December 31, 2023.
Comparison of the State Hospital System’s Staffing Levels, Census, and Waitlist Totals from September 2018 through December 2023
The data for census was not reported on weekends so it will not be visible in the visualization for each day the way staffing and the waitlist are.
While auditors identified inaccurate and incomplete records within the Commission’s data (see Chapter 4), the data was the best available source of information about the individuals on the waitlist.
State Hospital Capacity
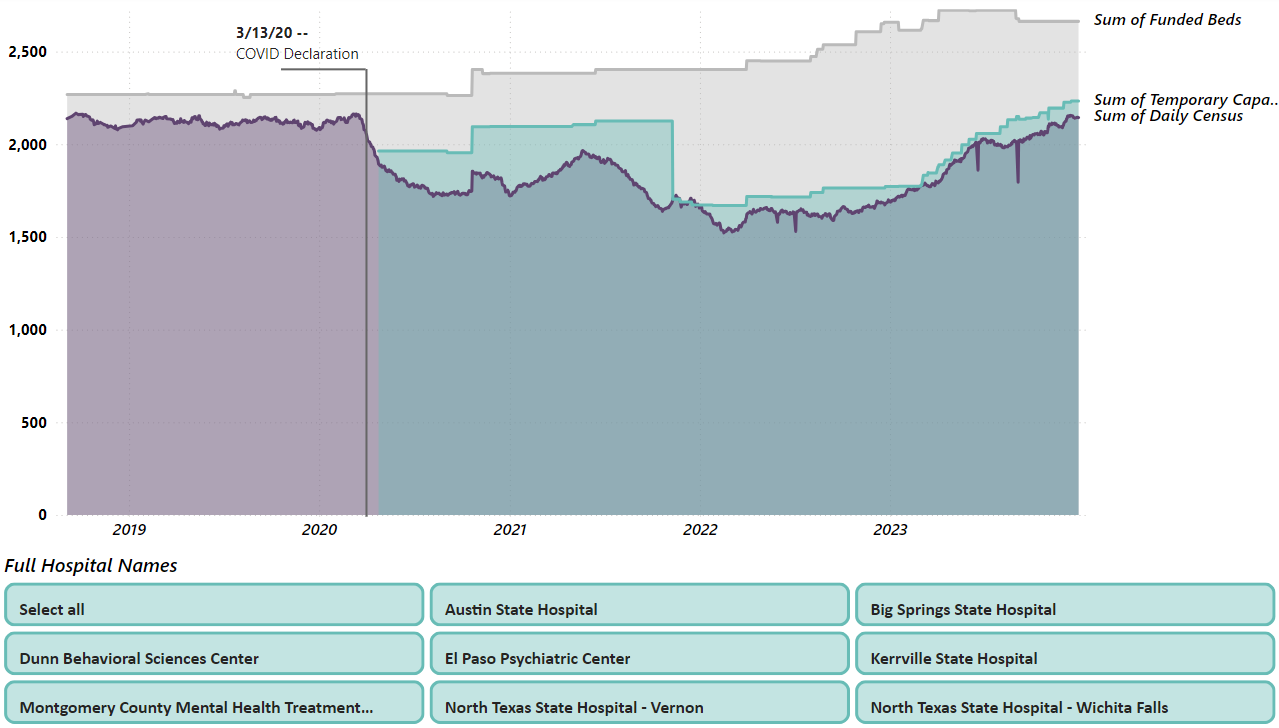
The most significant reason for the increased number of individuals on the waitlist for competency restoration was the limited availability of beds, which was made worse by the COVID-19 pandemic and ongoing challenges with staffing key medical positions. The visualization below shows the total beds estimate, census, and temporary capacity filterable by state hospital. Hover cursor over the visualization (or use the keyboard menu) to see the totals per day.
Select Shift + ? for keyboard shortcuts
State Hospital Bed Capacity from September 2018 through December 2023
The estimate that the Commission used to determine the number of available beds in the state hospital system, called “total beds”, was not set up to consider the conditions caused by the COVID-19 pandemic. This estimate was based on available state funds and the cost to fully staff and operate all beds at a state hospital. In April 2020, the Commission established a new estimate to account for factors such as limited staffing, the COVID-19 pandemic, and building construction. This estimate, called temporary capacity, provides a more accurate measure of the number of beds available.
Staffing
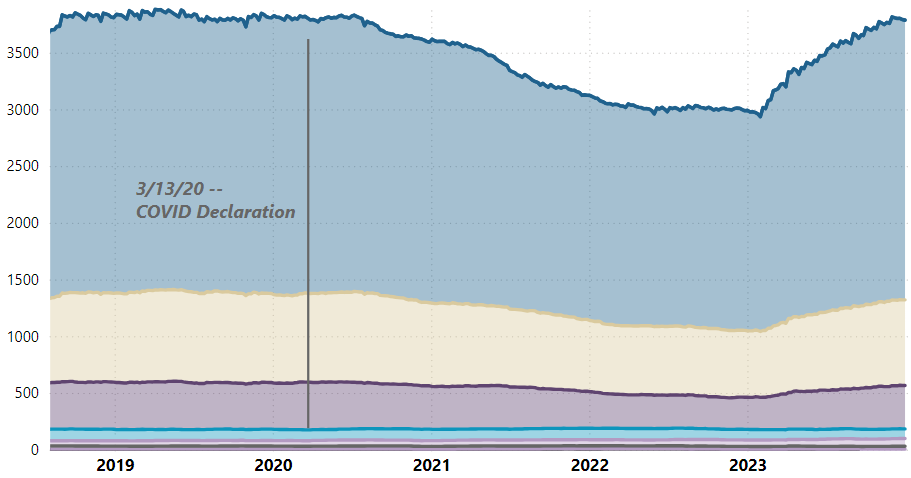
The Commission experienced additional challenges with hiring and retaining medical staff necessary for providing competency restoration in state hospitals. During the COVID-19 pandemic, the state hospital system experienced a significant decrease in the number of medical staff important to competency restoration, which corresponded to the growth of the waitlist. The visualization below shows the breakdown of daily staffing totals filterable by state hospital. Hover cursor over the visualization (or use the keyboard menu) to see the totals for each key position per day.
Select Shift + ? for keyboard shortcuts
Breakdown of Daily Staffing Totals by Day and Position
Waitlist
The number of individuals on the Commission’s waitlist for competency restoration grew from 650 individuals to a peak number of individuals on the waitlist during this time was 2,711, in December 2022. The visualization below shows the number of individuals on the waitlist for competency restoration filterable by age, gender, race, and ethnicity. It also contains accompanying charts to display the number of days individuals were waiting for competency restoration as well as what facilities they were admitted to. Hover cursor over the visualization (or use the keyboard menu) to see the totals per day.
Select Shift + ? for keyboard shortcuts
Waitlist Data from September 1, 2018, through June 30, 2024
*This visualization contains instances where data was not available for all filterable criteria. Those instances are noted as either Unknown or No Entry.
Waitlist by County
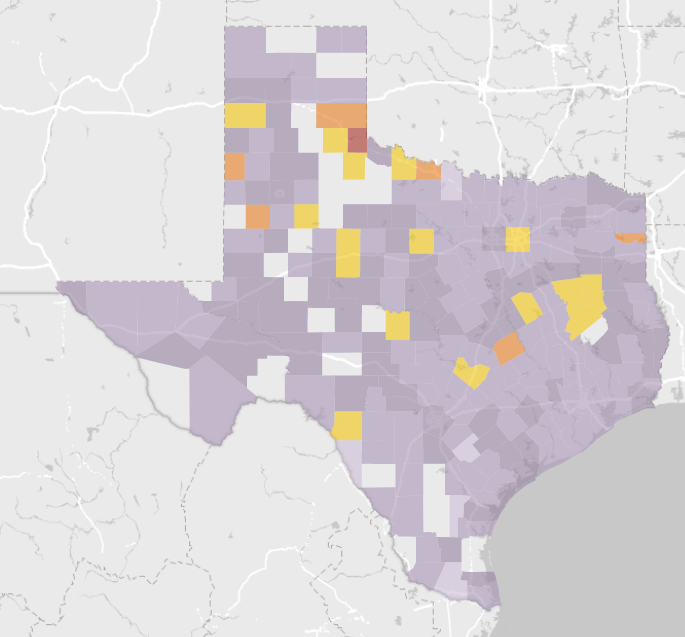
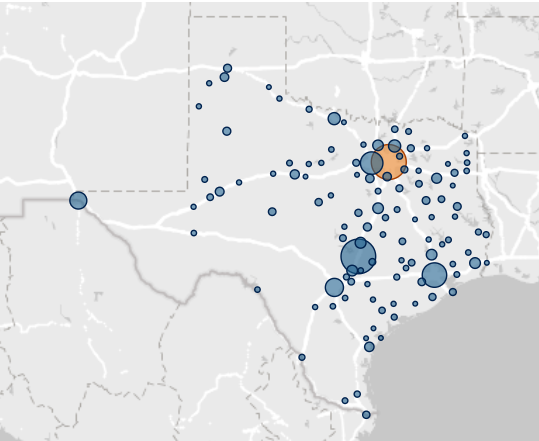
The visualization below shows the counties that committed the most individuals and the most individuals per capita to state hospitals for competency restoration from September 1, 2018, through December 31, 2023. Hover cursor over the visualization (or use the keyboard menu) to see the totals or select county to lock in the selected county.
Select Shift + ? for keyboard shortcuts
Waitlist Reoffenders by County
From September 1, 2018, through June 30, 2024, 1,528 (10 percent) of the 15,652 individuals on the waitlist appeared multiple times for new charges. The visualizations below show the number of reoffenders by county and the most common offenses for reoffenders. Hover cursor over the visualization (or use the keyboard menu) to see the totals per county or select county to lock in the selected county.
Select Shift + ? for keyboard shortcuts
Number of Reoffenders per County and Reoffenders per Capita
The county size filter for this visualization defines Urban as any county over 1 million in population, Mid-Sized as any county between 250,000 and 1,000,000 in population, and Rural as any county under 250,000 in population.
The top 5 counties for number of reoffenders also have the most individuals on the waitlist overall – Dallas County, Travis County, Harris County, Tarrant County, and Bexar County.
Top 5 Counties by Reoffenders 9/1/18-6/30/24
808
Dallas County
676
Travis County
359
Harris County
309
Tarrant County
152
Bexar County
Alternative Competency Restoration Programs
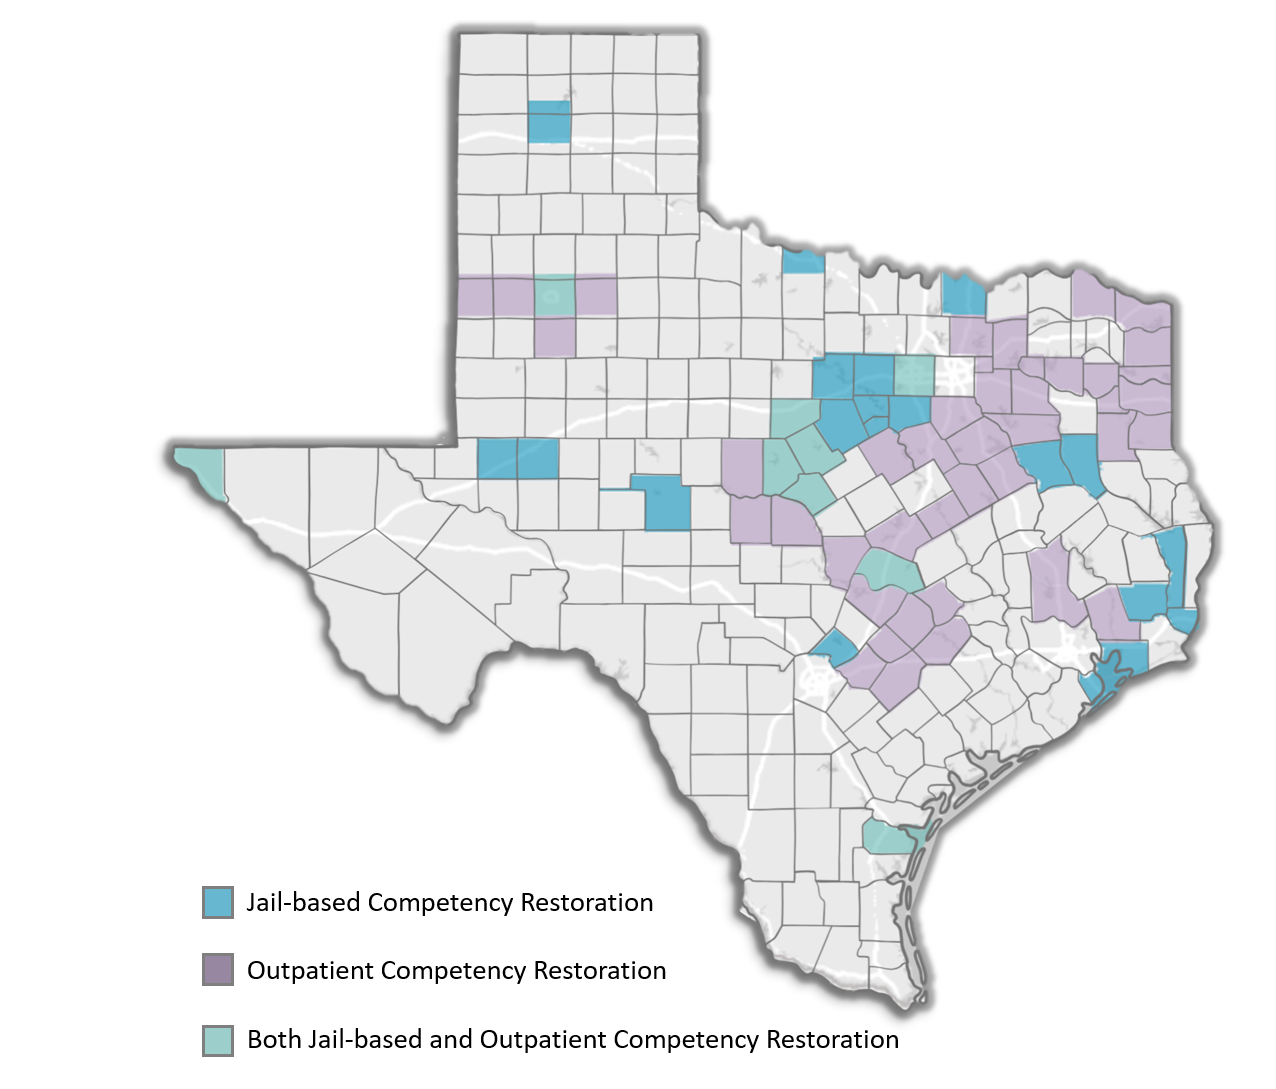
A limited number of counties used outpatient competency restoration (OCR) programs or jail-based competency restoration (JBCR) programs as alternatives for treatment of individuals waiting for admission to a state hospital. The visualization below shows the 20 counties with jail-based programs, the 43 counties with outpatient programs, and the 14 counties with both as of June 2024. Hover cursor over the visualization (or use the keyboard menu) to see the type of program(s) and the county’s local mental health authority or local behavioral health authority or select county to lock in the selected county.
Select Shift + ? for keyboard shortcuts
